Key Metrics and KPIs for Measuring Conversion Rate Optimization (CRO)
June 03, 2024 | Digital Techtune

Conversion Rate Optimization (CRO) is the process of enhancing a website or landing page to increase the percentage of visitors who take a desired action. These actions, or conversions, can vary widely—from making a purchase, to signing up for a newsletter, to downloading a whitepaper. To effectively measure and optimize CRO efforts, businesses must track a variety of key metrics and Key Performance Indicators (KPIs). This article explores the most critical metrics and KPIs for measuring CRO, providing insights into how each can inform and guide your optimization strategies.
1. Conversion Rate
Definition: The conversion rate is the percentage of visitors who complete the desired action out of the total number of visitors.
Importance: As the primary metric for CRO, the conversion rate provides a direct measure of the effectiveness of your website or landing page in driving conversions.
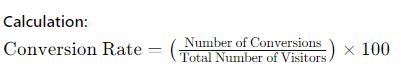
Example: If a website receives 10,000 visitors in a month and 500 of those visitors make a purchase, the conversion rate is 5%.
Analysis: A high conversion rate indicates that the website or landing page is effectively convincing visitors to take the desired action. Conversely, a low conversion rate suggests the need for optimization efforts.
2. Click-Through Rate (CTR)
Definition: The click-through rate is the percentage of people who click on a link, ad, or call-to-action (CTA) out of the total number of people who view it.
Importance: CTR is crucial for understanding the effectiveness of your content and CTAs. High CTRs typically lead to higher conversion rates.

Example: If an email campaign is sent to 1,000 recipients and 100 of them click on a link in the email, the CTR is 10%.
Analysis: A low CTR may indicate that your messaging, design, or placement of CTAs needs improvement. Testing different elements can help identify what resonates best with your audience.
3. Bounce Rate
Definition: The bounce rate is the percentage of visitors who navigate away from the site after viewing only one page.
Importance: Bounce rate is a key indicator of user engagement and website relevance. High bounce rates can negatively impact conversion rates.
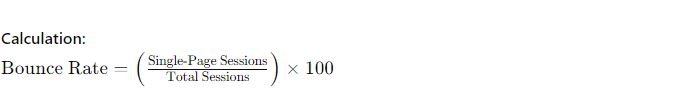
Example: If 1,000 users visit your website and 400 of them leave after viewing only one page, the bounce rate is 40%.
Analysis: High bounce rates often indicate that visitors are not finding what they are looking for or that the page lacks engaging content. Reducing bounce rates through better content, design, and user experience can lead to higher conversion rates.
4. Average Session Duration
Definition: Average session duration is the average amount of time visitors spend on your website during a session.
Importance: Longer session durations generally indicate higher levels of user engagement, which can lead to higher conversion rates.

Example: If the total duration of all sessions in a month is 500,000 seconds and there are 10,000 sessions, the average session duration is 50 seconds.
Analysis: Low average session durations may suggest that visitors are not finding your content engaging or useful. Improving content quality and navigation can help increase the time visitors spend on your site.
5. Pages Per Session
Definition: Pages per session is the average number of pages viewed during a session on your website.
Importance: This metric indicates how deeply users are engaging with your content. More pages per session often correlate with higher conversion rates.
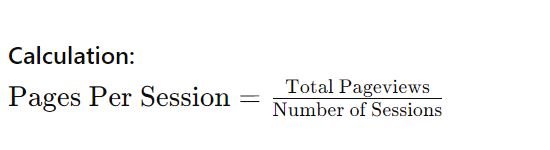
Example: If your website has 100,000 pageviews and 25,000 sessions in a month, the pages per session is 4.
Analysis: A low number of pages per session may indicate that visitors are not finding your site navigation intuitive or that the content is not compelling enough to explore further. Enhancing internal linking and content relevance can improve this metric.
6. Cart Abandonment Rate
Definition: The cart abandonment rate is the percentage of users who add items to their cart but do not complete the purchase.
Importance: This metric is critical for e-commerce sites as it directly impacts sales and revenue.
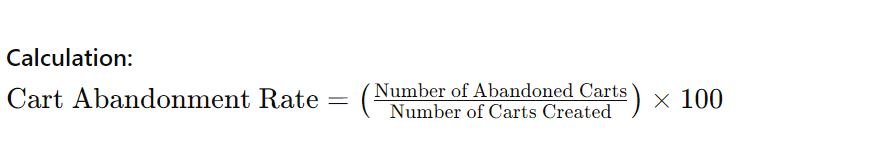
Example: If 1,000 users add items to their cart and 700 of them do not complete the purchase, the cart abandonment rate is 70%.
Analysis: High cart abandonment rates can signal issues with the checkout process, such as complicated forms, unexpected costs, or security concerns. Streamlining the checkout process and addressing common pain points can reduce cart abandonment and increase conversions.
7. Cost Per Conversion (CPC)
Definition: Cost per conversion is the amount of money spent on marketing to achieve one conversion.
Importance: CPC is a vital metric for understanding the efficiency of your marketing spend. Lowering CPC while maintaining or increasing conversions is a key goal.
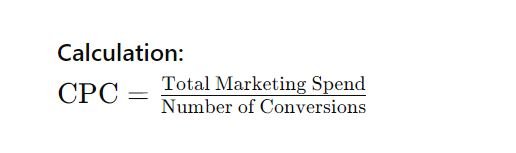
Example: If a company spends $10,000 on a marketing campaign and achieves 500 conversions, the CPC is $20.
Analysis: High CPC may indicate that your marketing efforts are not as efficient as they could be. Optimizing your marketing channels, targeting, and messaging can help lower CPC and improve overall ROI.
8. Return on Investment (ROI)
Definition: ROI measures the profitability of your marketing campaigns relative to the cost.
Importance: ROI provides a comprehensive view of the financial performance of your CRO efforts.
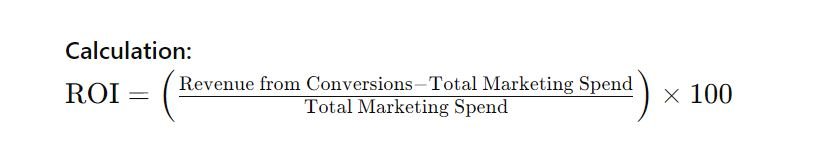
Example: If a marketing campaign generates $50,000 in revenue and costs $10,000, the ROI is 400%.
Analysis: Positive ROI indicates profitable campaigns, while negative ROI suggests that the campaigns are costing more than they are generating. Continual analysis and optimization are necessary to maximize ROI.
9. Customer Lifetime Value (CLV)
Definition: CLV is the total revenue a business can expect from a single customer account over the customer’s lifespan.
Importance: CLV helps businesses understand the long-term value of their customers and informs strategies for customer retention and acquisition.
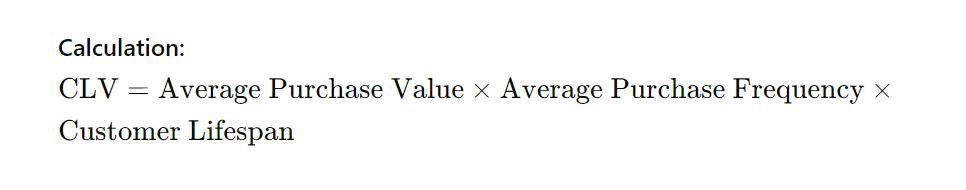
Example: If the average purchase value is $100, the average purchase frequency is 4 times per year, and the average customer lifespan is 5 years, the CLV is $2,000.
Analysis: Increasing CLV can significantly boost revenue. Strategies such as improving customer service, enhancing product quality, and creating loyalty programs can help increase CLV.
10. Lead Conversion Rate
Definition: The lead conversion rate is the percentage of leads that turn into paying customers.
Importance: This metric is essential for businesses that rely on lead generation, such as B2B companies.
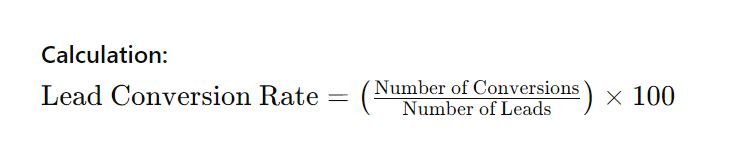
Example: If a company generates 1,000 leads and 200 of them become paying customers, the lead conversion rate is 20%.
Analysis: A low lead conversion rate may indicate issues with the quality of leads or the sales process. Improving lead qualification and nurturing processes can help increase this rate.
11. New vs. Returning Visitors
Definition: This metric compares the number of new visitors to your website against returning visitors.
Importance: Understanding the ratio of new to returning visitors helps in assessing the effectiveness of both acquisition and retention strategies.
Calculation: This metric is usually presented as a ratio or percentage, available through web analytics tools like Google Analytics.
Example: If your website has 10,000 visitors in a month, with 6,000 being new visitors and 4,000 returning visitors, the ratio is 60:40.
Analysis: A high percentage of returning visitors typically indicates good user satisfaction and engagement. Efforts to attract new visitors should be balanced with strategies to retain existing ones.
12. Customer Acquisition Cost (CAC)
Definition: CAC is the cost associated with acquiring a new customer.
Importance: CAC is a crucial metric for understanding the efficiency of your marketing and sales efforts.
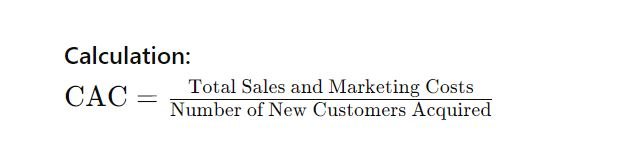
Example: If a company spends $50,000 on sales and marketing in a month and acquires 500 new customers, the CAC is $100.
Analysis: High CAC may indicate inefficiencies in your marketing or sales processes. Reducing CAC while maintaining the quality of acquired customers is a key objective.
13. Funnel Drop-off Rate
Definition: Funnel drop-off rate measures the percentage of users who abandon the conversion process at each stage of the sales funnel.
Importance: Identifying where users drop off can help pinpoint specific areas that need optimization.
Calculation: This metric is calculated for each stage of the funnel and varies depending on the number of users entering and leaving each stage.
Example: If 1,000 users enter the funnel, 600 proceed to the next stage, and 400 drop off, the drop-off rate for that stage is 40%.
Analysis: High drop-off rates at specific stages indicate where users are losing interest or encountering issues. Addressing these pain points can improve the overall conversion rate.
14. Churn Rate
Definition: Churn rate is the percentage of customers who stop using your product or service within a given period.
Importance: Churn rate is critical for understanding customer retention and the long-term viability of your business.
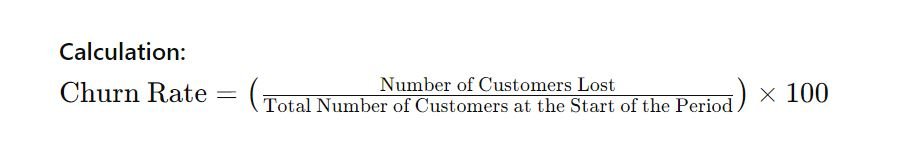
Example: If a company has 1,000 customers at the beginning of the month and loses 50 by the end, the churn rate is 5%.
Analysis: High churn rates suggest issues with customer satisfaction or product quality. Improving customer support, product features, and overall user experience can help reduce churn.
15. Engagement Metrics (e.g., Social Shares, Comments, Likes)
Definition: Engagement metrics measure the interactions users have with your content on social media and other platforms.
Importance: High engagement levels often correlate with higher brand awareness and loyalty, indirectly boosting conversions.
Calculation: These metrics vary depending on the platform but generally include the total number of likes, shares, comments, etc.
Example: If a blog post receives 1,000 likes, 200 shares, and 100 comments, the total engagement is 1,300.
Analysis: Low engagement may indicate that your content is not resonating with your audience. Creating more relevant, valuable, and engaging content can improve these metrics.
Measuring and optimizing CRO requires a comprehensive understanding of various metrics and KPIs. Each metric provides unique insights into different aspects of user behavior and the effectiveness of your website or landing page. By closely monitoring these metrics and implementing data-driven optimization strategies, businesses can significantly improve their conversion rates, enhance user experience, and ultimately achieve their marketing and sales goals.